
client:
Women in Tech World
Report: Canada's Gender Equity Roadmap report | Feuille de route pour l’égalité des genres au Canada
role:
Visual designer for Women in Tech World (data visualization, illustrations, PPT templates, Indoor banner)
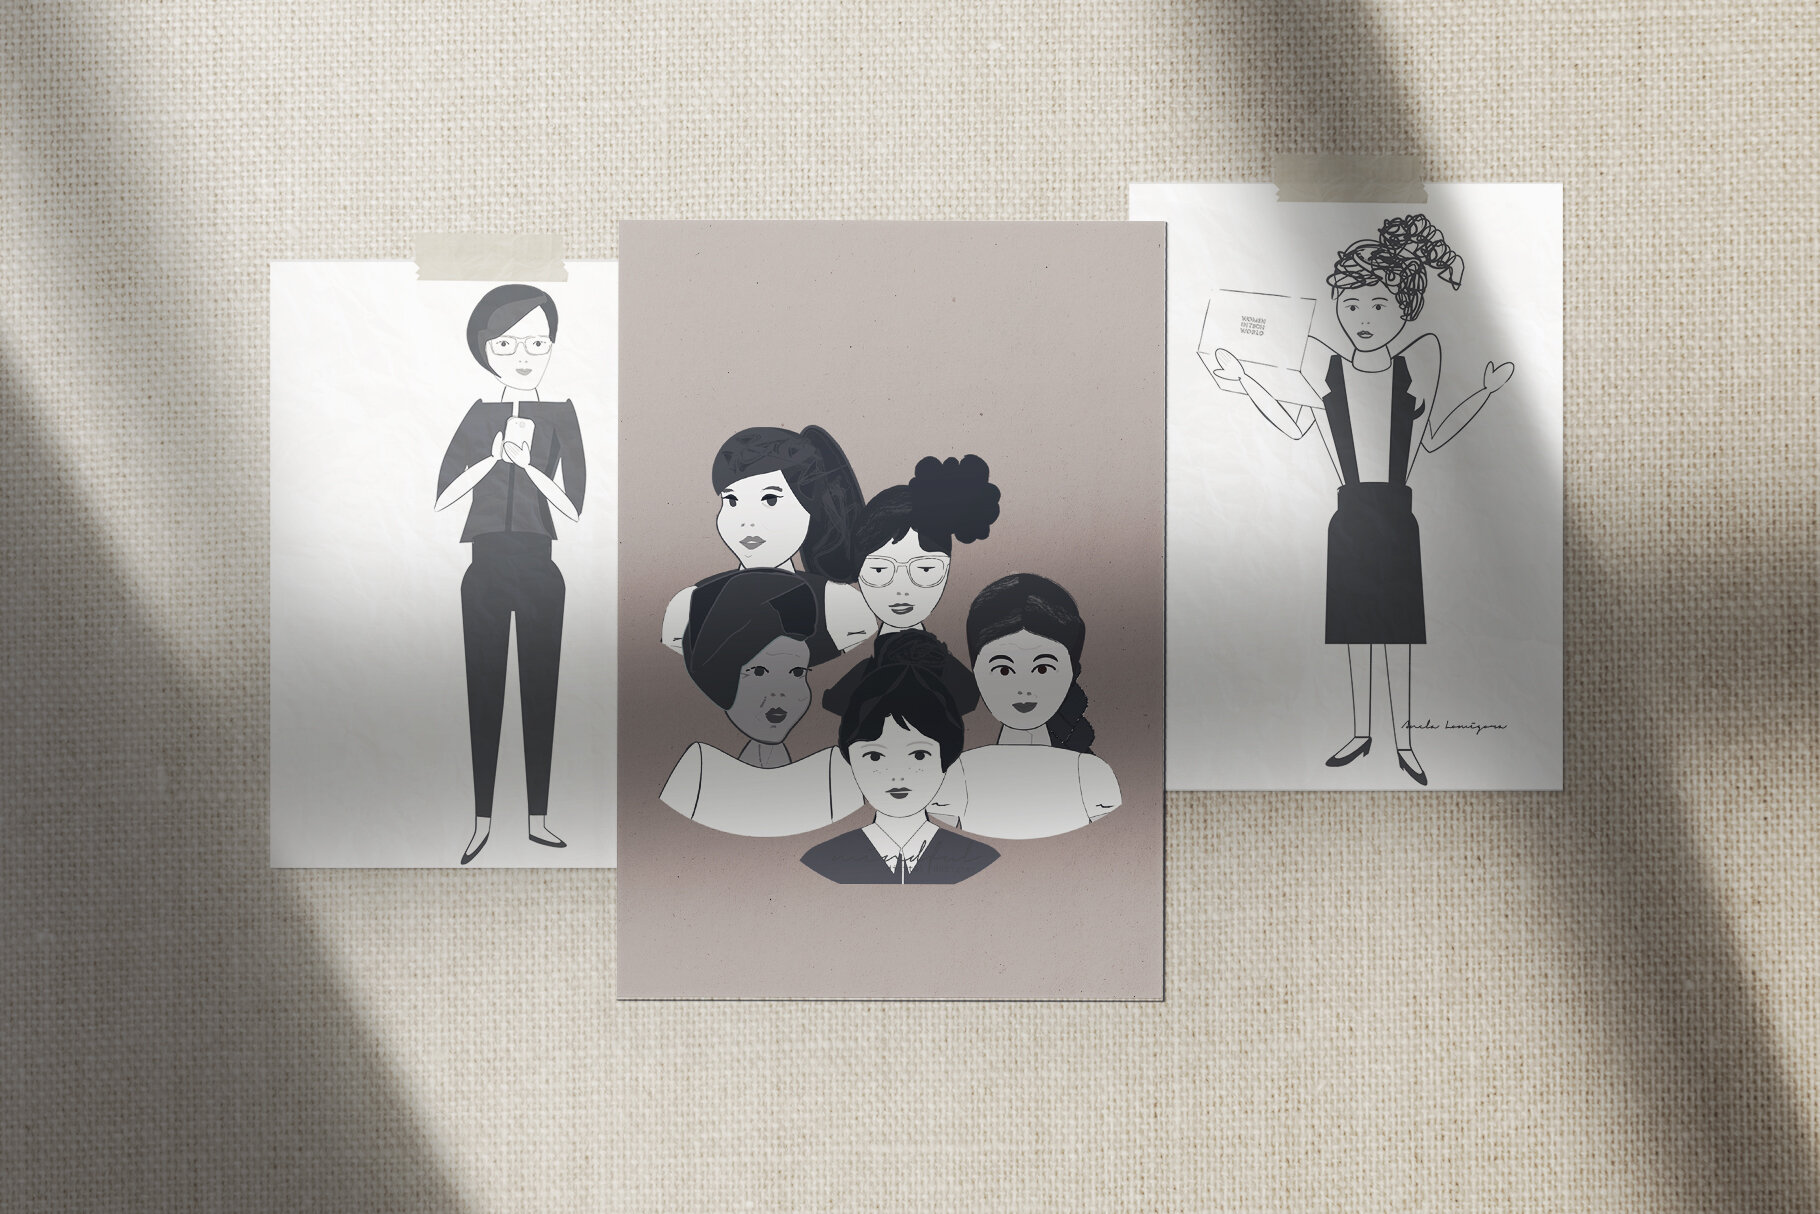
In the role of Visual Designer I was tasked with producing data visualization and illustrations for the success stories spread, as well as character illustrations for the foreword page. Illustration backgrounds were designed by my colleagues.
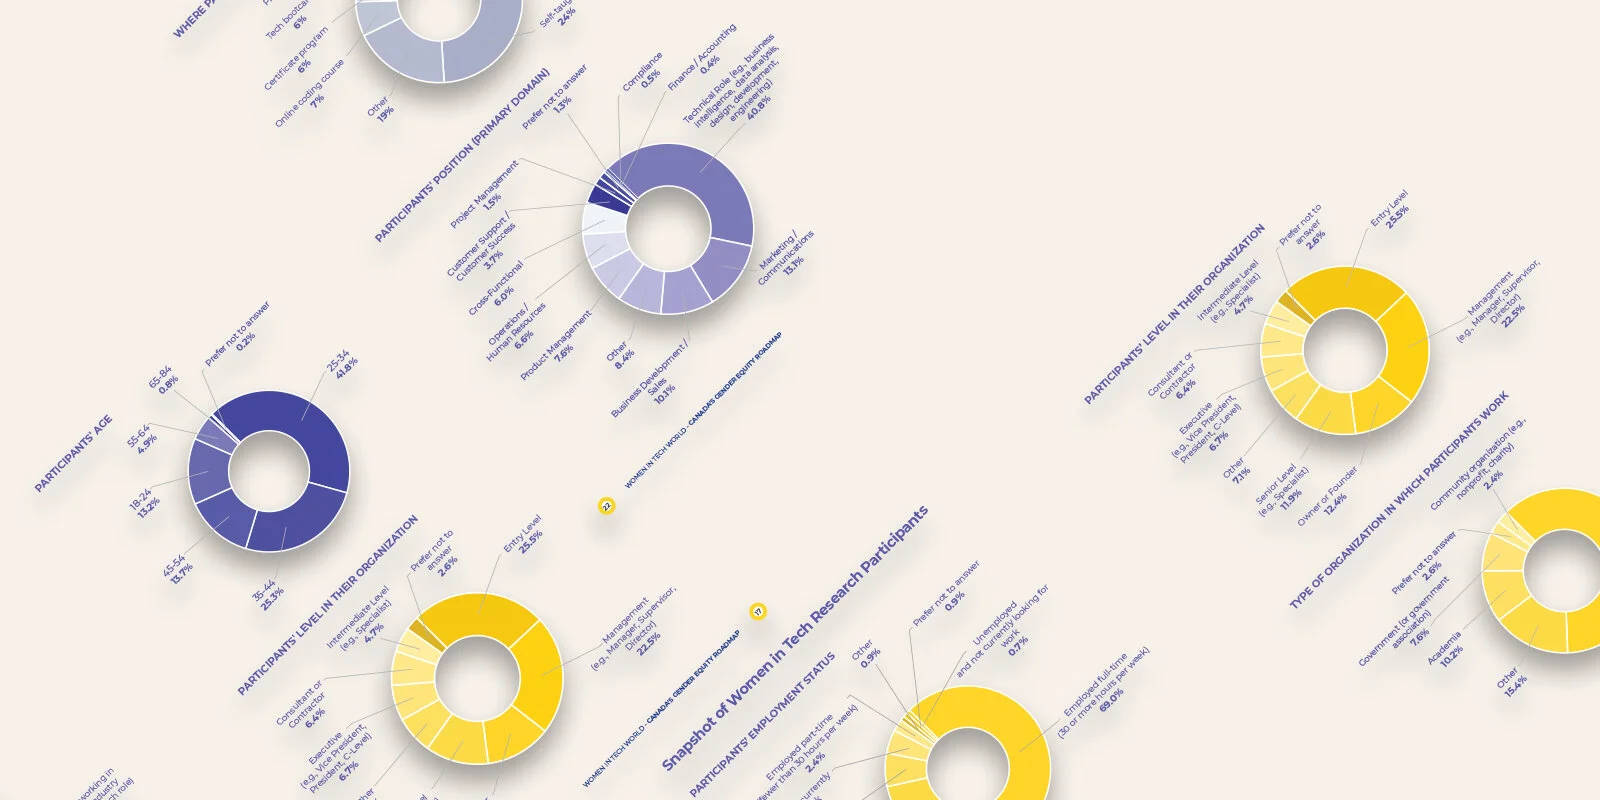
Data Visualization - eleven monochromatic pie-charts
Data visualization (Ref: Pages - 14, 16, 17, 20, 21, 22, 23,)
Created five avatars for the Success Stories spread
Illustrations (Ref: Pages - 26, 27)
Created two character illustrations for “The FOREWORD page” (Ref. Page 4) These illustrations have also been published in the B.C.'s Gender Equity Roadmap report - pg 4.
My work was also published:
· B.C.'s Gender Equity Roadmap report
video - a snapshot of the report.
Full version of the report is available on WOMEN IN TECH website. This video is for the reference purpose only.
My contribution in creation of this document: Data Visualization - eleven monochromatic pie-charts - (Ref: Pages - 14, 16, 17, 20, 21, 22, 23); Created five avatars for the Success Stories spread - (Ref: Pages - 26, 27); Created two character illustrations for “The FOREWORD page” - (Ref. Page 4)


social media content.
The team used illustrations to promote Canada’s Gender Equity Report on social media.